instrument report · Metals
Gold GC
Historical statistics for Gold over 45,036 observations, from 2010-06-07 to 2026-09-16. Every table shows its sample size (n) next to the percentage.
What sets this instrument apart
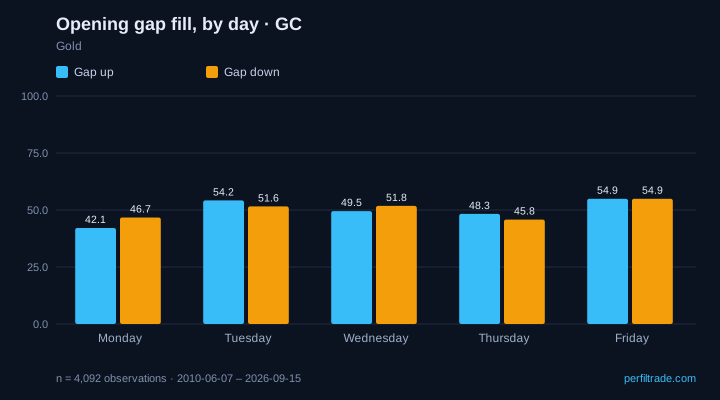
- In GC an upside gap fills 54.9% of the time on a Friday and 42.1% on a Monday: 12.8 percentage points between two days of the same week.
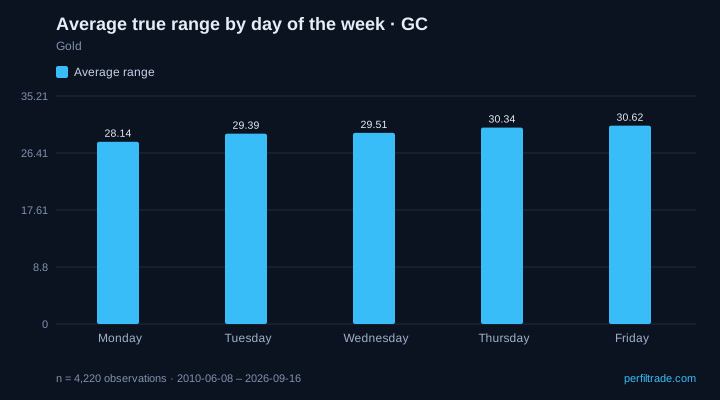
- The busiest day is Friday, with an average range of 30.62 points, and the quietest is Monday, with 28.14: a 9% difference worth accounting for when sizing the stop.
- The day's high is made in the London session 43.2% of the time, across 4,155 sessions.
- When it breaks the Initial Balance high, the session closes beyond it 48.9% of the time; when it breaks the low, 48.7%. The asymmetry between the two sides is what sets GC apart from other contracts.
Tables
Historical frequencies, not forecasts: each row's sample size sits on the right.
Opening gap fill, by day
GC
| Day | Gap up | Gap down | Sessions |
|---|---|---|---|
| Monday | 42.1% | 46.7% | 826 |
| Tuesday | 54.2% | 51.6% | 814 |
| Wednesday | 49.5% | 51.8% | 818 |
| Thursday | 48.3% | 45.8% | 822 |
| Friday | 54.9% | 54.9% | 812 |
n = 4,092 · 2010-06-07 to 2026-09-15 · exchange data
Gap measured from the prior regular-session close to today's open. Fill = price trades back to that close within the same regular session.
Gap fill by gap size
GC
| Gap size | Gap up | Gap down | Sessions |
|---|---|---|---|
| 0-0.1% | 92.5% | 88.1% | 598 |
| 0.1-0.25% | 75.6% | 74.4% | 872 |
| 0.25-0.5% | 51.8% | 51.4% | 1,080 |
| 0.5-1.0% | 24.1% | 25.2% | 996 |
| >1.0% | 9.9% | 7.5% | 546 |
n = 4,092 · 2010-06-07 to 2026-09-15 · exchange data
Gap size changes the outcome more than any other variable: read this table before the day-of-week one.
Initial Balance break and close beyond the level
GC
| Day | Breaks the high | Breaks the low | Breaks |
|---|---|---|---|
| Monday | 49.8% | 46.9% | 1,054 |
| Tuesday | 47.6% | 50.3% | 1,066 |
| Wednesday | 47.6% | 50.2% | 1,057 |
| Thursday | 50.0% | 50.3% | 993 |
| Friday | 49.6% | 45.4% | 963 |
n = 5,133 · 2010-06-07 to 2026-09-15 · exchange data
IB = the range of the first 60 minutes of the regular session. The percentage is how often the session closed beyond the broken extreme, not how often a break happened.
Breaking yesterday's range and the closing colour
GC
| Day | Breaks the high and closes green | Breaks the low and closes red | Breaks |
|---|---|---|---|
| Monday | 66.5% | 71.7% | 719 |
| Tuesday | 73.5% | 69.8% | 841 |
| Wednesday | 69.6% | 66.6% | 805 |
| Thursday | 71.2% | 76.2% | 822 |
| Friday | 77.3% | 67.7% | 749 |
n = 3,936 · 2010-06-07 to 2026-09-16 · exchange data
Session colour = close versus the same day's open. It does not measure whether the close held beyond the broken level. A day that breaks both sides counts in both columns.
Does the overnight direction carry into the regular session?
GC
| Day | Overnight up | Overnight down | Sessions |
|---|---|---|---|
| Monday | 47.7% | 49.0% | 826 |
| Tuesday | 46.0% | 48.4% | 814 |
| Wednesday | 49.3% | 48.2% | 818 |
| Thursday | 47.4% | 48.3% | 822 |
| Friday | 53.3% | 50.1% | 812 |
n = 4,092 · 2010-06-07 to 2026-09-15 · exchange data
Overnight direction = from yesterday's regular close to today's open. The percentage is how often the regular session then moved the same way.
Where the day's high and low are made
GC
| Session | High of day | Low of day | Sessions |
|---|---|---|---|
| Asia | 26.2% | 28.9% | 4,155 |
| London | 43.2% | 45.3% | 4,155 |
| New York | 8.9% | 7.4% | 4,155 |
| Outside sessions | 21.7% | 18.4% | 4,155 |
n = 16,620 · 2010-06-07 to 2026-09-15 · exchange data
How the daily extreme splits across the three sessions of the 24-hour cycle.
Average true range by day of the week
GC
| Day | Average range | Sessions |
|---|---|---|
| Monday | 28.1 pts | 849 |
| Tuesday | 29.4 pts | 849 |
| Wednesday | 29.5 pts | 848 |
| Thursday | 30.3 pts | 848 |
| Friday | 30.6 pts | 826 |
n = 4,220 · 2010-06-08 to 2026-09-16 · exchange data
Average daily true range in the instrument's own points. Useful for sizing the stop distance, not for anticipating direction.
Gap fill between calendar days
GC
| Day | Gap up | Gap down | Sessions |
|---|---|---|---|
| Monday | 76.7% | 82.3% | 837 |
| Tuesday | 97.6% | 98.0% | 507 |
| Wednesday | 95.0% | 99.2% | 500 |
| Thursday | 96.0% | 98.4% | 520 |
| Friday | 97.9% | 99.2% | 487 |
n = 2,851 · 2010-06-07 to 2026-09-16 · exchange data
Here the gap is measured between the close and the open of whole calendar days, not against the regular session. In a contract trading nearly 24 hours that gap is small and fills far more often.
To understand these numbers
These guides explain how each concept is calculated and how to read it without fooling yourself.
Opening Gap in Index Futures: A Data-Driven Guide
Initial Balance: What It Is and How to Use It Intraday
Value Area, POC, VAH and VAL: How to Read Value
RTH vs Globex in Index Futures: What Changes
Position Sizing in Futures: How to Calculate It
Other instruments in the family
Historical frequencies describe what happened; they do not guarantee what will happen and are not investment advice.