TradingView indicators
Four free indicators, every percentage with its sample
They bring to your own chart what we measure on the platform: the session's levels, its structure and how often something happened in past sessions. They are public, open source and added in one click. None of them gives signals.
- Free
- Open source
- Every percentage with its n
- No signals
Perfiltrade IB and Gap Overlay
IB and gap
How often did a gap like today's fill?
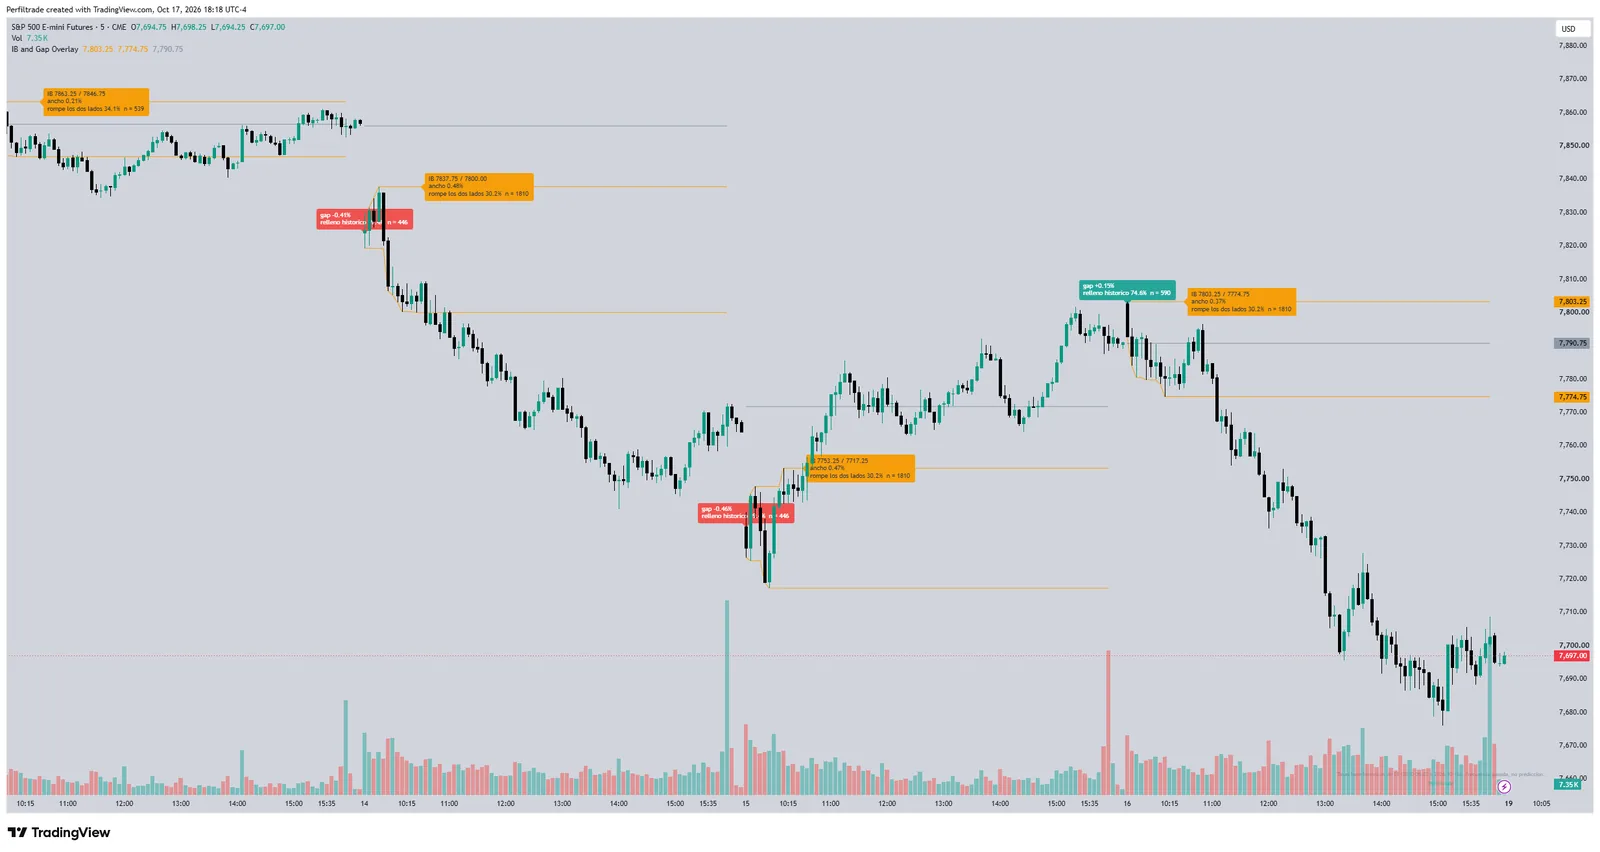
- Draws the Initial Balance and the opening gap on your chart.
- Next to the gap, how often one of that size and direction filled, with its n.
- Nine instruments with tables of their own: ES, NQ, RTY, YM, NKD, gold and the 5, 10 and 30 year Treasury futures.
How it is computed
The indicator sets the session window from the contract, because the figure describes the window it was measured in: override it and the rates hide instead of showing a figure that does not apply. Value Area and POC are drawn by Key Levels and Session Profile.
Key Levels and Expected Range
Key Levels
How far did price travel from the open in past sessions?
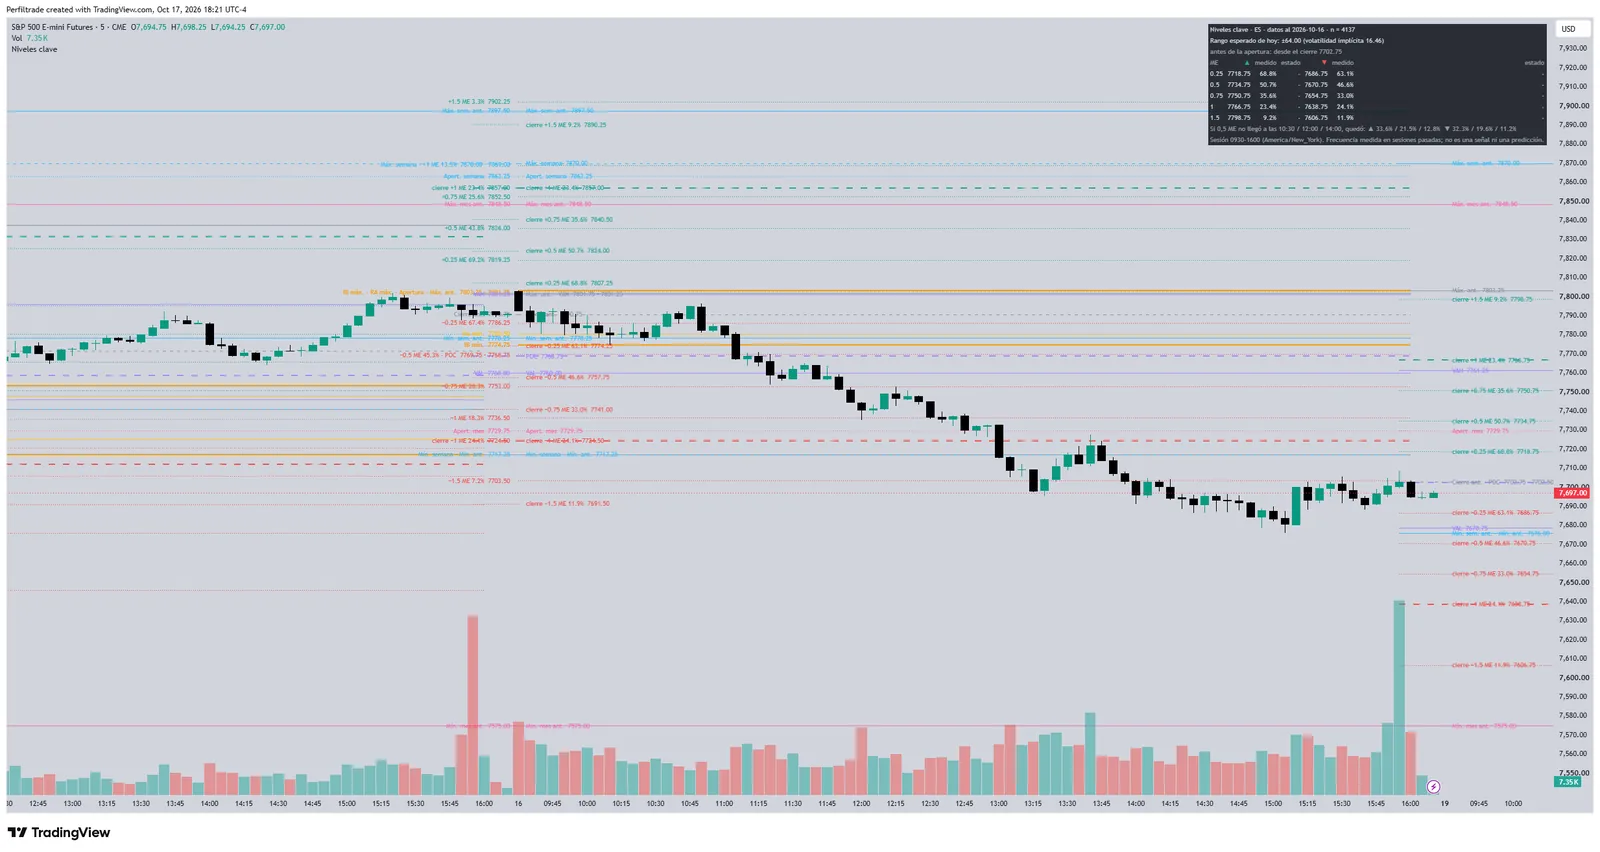
- High, low, close, Value Area and POC of the prior session, the week's and month's, the opening range and the Initial Balance.
- A ladder of distances from the open, from 0.25 to 1.5 times the day's typical move, with how often price reached each rung and its n.
- Statistics for 29 futures; on other symbols it draws the levels and leaves the percentages blank.
How it is computed
The prior session's profile uses 30-minute periods and a 70% value area. Before the open, the ladder starts from the prior close. Levels are fixed once their period closes; only the table updates inside the bar. Charts from 1 to 60 minutes.
Session Setup State
Setup State
What state are today's gap, Initial Balance and opening range in?
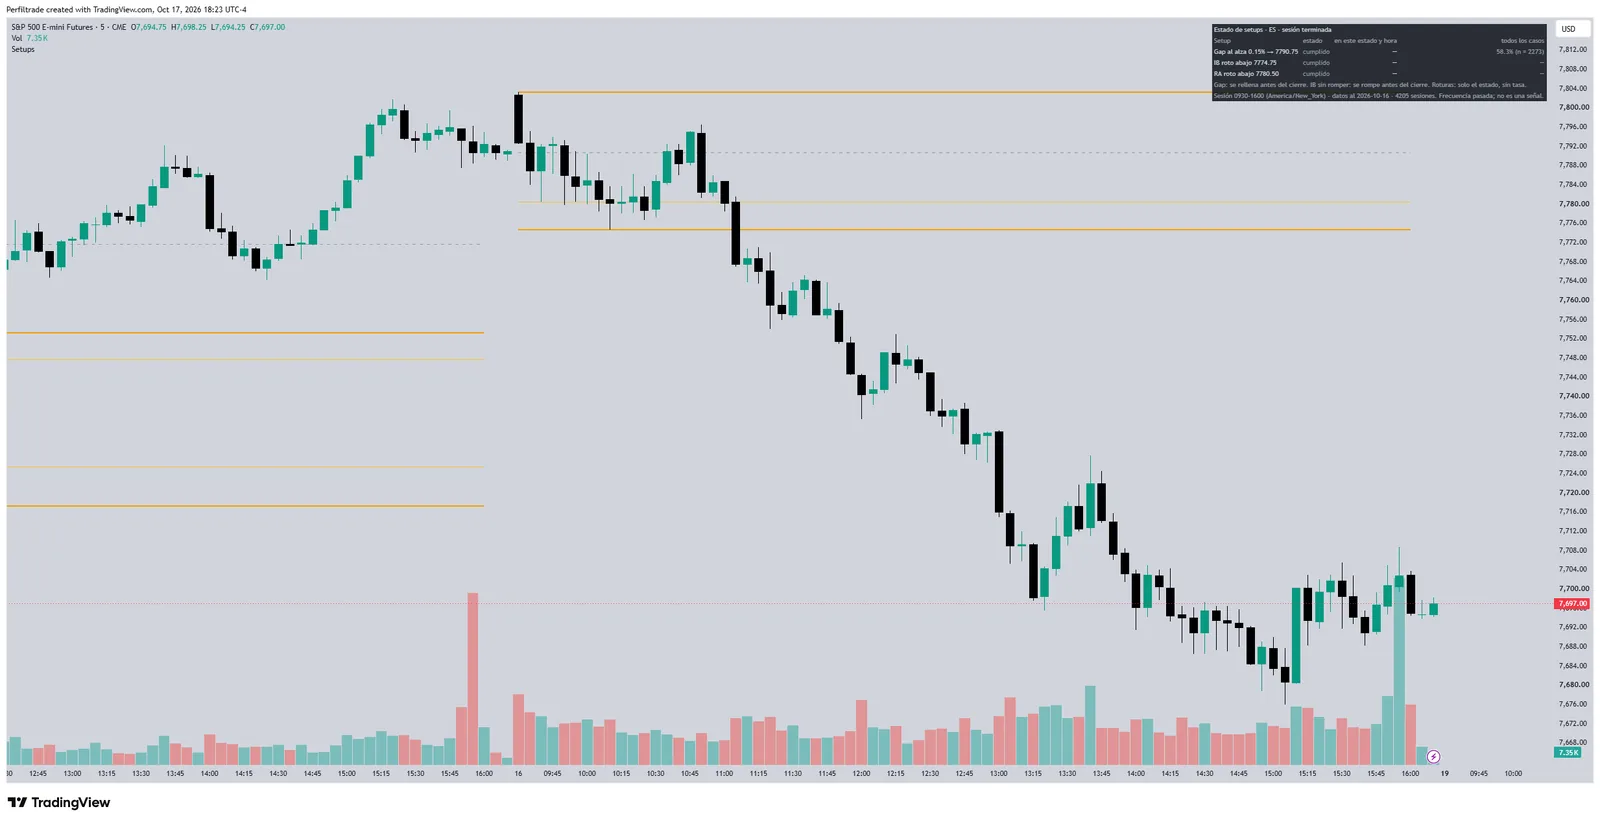
- For each reading, its state: in play, back inside, done or invalidated.
- While the gap is open, how many past sessions that had it open at the same time of day filled it before the close, with the rate of all cases as the base.
- A broken range shows only its state, with no percentage, and a rate with fewer than 10 cases is not printed.
How it is computed
Frequencies are measured on past sessions of the same market at the same time of the session, pooled over all weekdays. While the Initial Balance is unbroken, it shows how often one of that size broke before the close. Levels are fixed once their window is complete.
Session Time-at-Price Profile
Session Profile
Where did price spend the most time during the session?
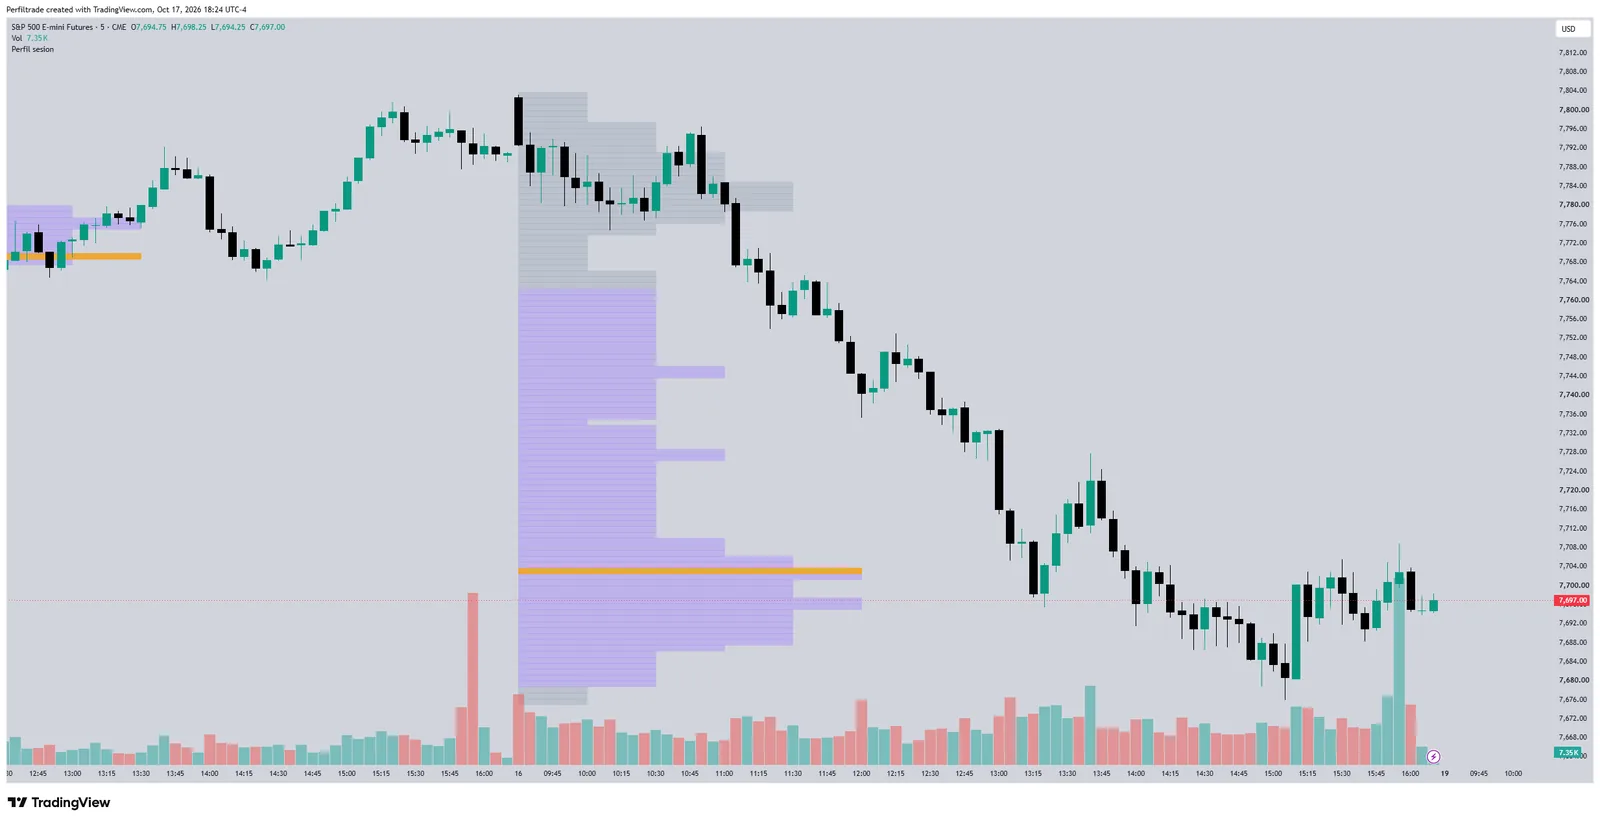
- A time-at-price profile of the regular session in progress and the one before it.
- POC and a 70% Value Area, with optional period letters.
- The same profile on any timeframe: when bars do not line up with the 30-minute periods, it reads intrabars.
How it is computed
Each 30-minute period that traded at a price adds a block to that row. The POC is the row with the most periods and the value area grows from it to 70% of the blocks. The profile in progress changes until the close; a finished one no longer changes.
Use them together
Each one answers a different question, so they complement each other. In the capture, IB and gap, Setup State and Session Profile on the same ES session.
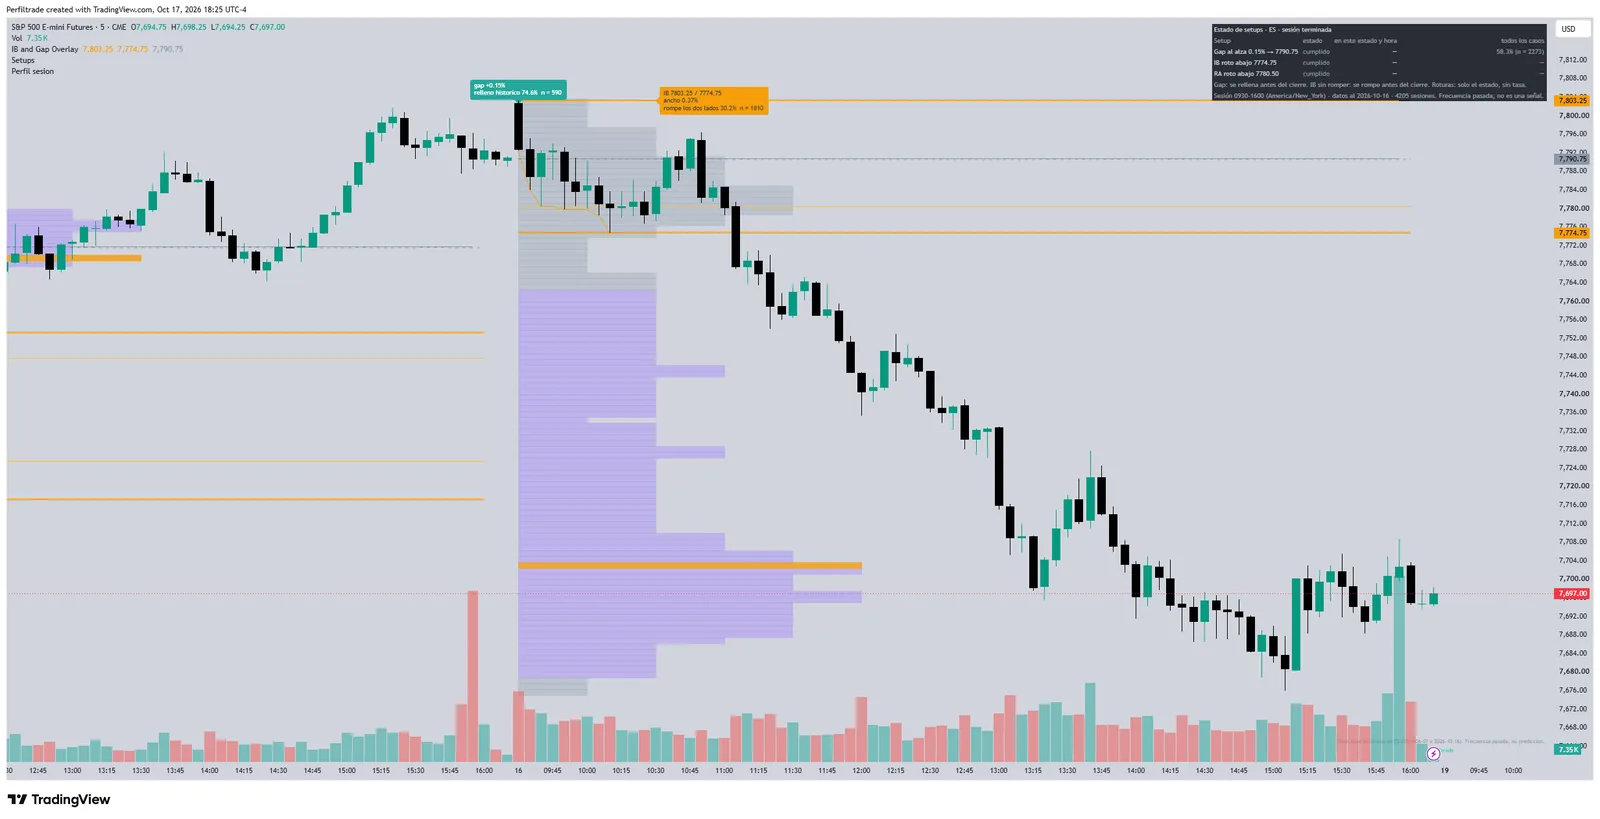
- Session Profile
- where price was accepted
- Key Levels
- the day's references and how far it usually travels
- IB and gap
- how big the gap is and how often one like it filled
- Setup State
- where each reading stands right now
Frequently asked questions
Are they free?
Yes. All four are public and open source on TradingView, and you add them with a free account. TradingView's free plan limits how many indicators you can have on a chart at once.
Do they repaint?
Key Levels and Setup State fix each level when its period or window ends; only the table updates inside the bar. The Session Profile of the session in progress changes until the close, and a finished session's profile no longer changes.
What data do they use?
The data of the chart you open them on. The historical frequencies are embedded in the indicator and say up to which date they were measured and over how many sessions.
Why do they give no signals?
Because a historical percentage describes how much and how often the market moved in the past, not where it will go today. That is why every figure comes with its sample and none of them suggests trades.
The full statistics, on the platform
The indicators show one part. Perfiltrade has the reports on 30 futures, the session's Market Profile and the context of every figure.
Try 14 days free