instrument report · Rates
3-Month SOFR SR3
Historical statistics for 3-Month SOFR over 13,194 observations, from 2018-05-07 to 2026-08-28. Every table shows its sample size (n) next to the percentage.
What sets this instrument apart
- The gap between one day's close and the next day's open fills in SR3 between 26.5% and 32.6% of the time depending on the day. In a contract trading nearly 24 hours that gap is small, which is why it closes so often: it is not a tradable edge.
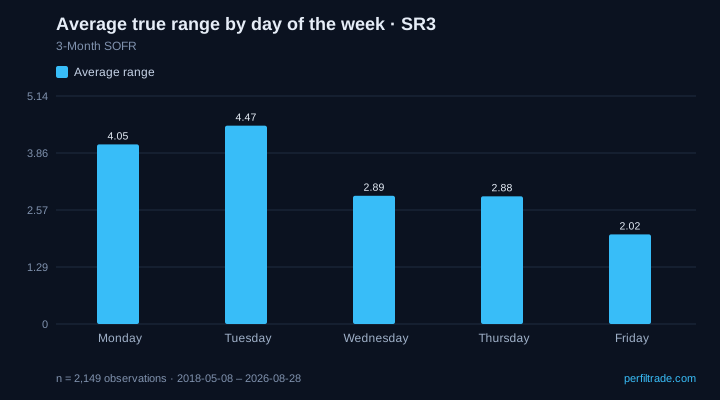
- The busiest day is Tuesday, with an average range of 4.47 points, and the quietest is Friday, with 2.02: a 121% difference worth accounting for when sizing the stop.
- After three or more days in the same direction, SR3 keeps going that way 55.6% of the time (n = 594). The idea that 'after three days it turns' gets checked here, not assumed.
Tables
Historical frequencies, not forecasts: each row's sample size sits on the right.
Breaking yesterday's range and the closing colour
SR3
| Day | Breaks the high and closes green | Breaks the low and closes red | Breaks |
|---|---|---|---|
| Monday | 45.6% | 74.9% | 375 |
| Tuesday | 56.1% | 68.4% | 430 |
| Wednesday | 59.2% | 68.8% | 415 |
| Thursday | 53.6% | 67.7% | 389 |
| Friday | 53.6% | 68.9% | 390 |
n = 1,999 · 2018-05-07 to 2026-08-28 · exchange data
Session colour = close versus the same day's open. It does not measure whether the close held beyond the broken level. A day that breaks both sides counts in both columns.
Average true range by day of the week
SR3
| Day | Average range | Sessions |
|---|---|---|
| Monday | 4.1 pts | 429 |
| Tuesday | 4.5 pts | 432 |
| Wednesday | 2.9 pts | 430 |
| Thursday | 2.9 pts | 432 |
| Friday | 2.0 pts | 426 |
n = 2,149 · 2018-05-08 to 2026-08-28 · exchange data
Average daily true range in the instrument's own points. Useful for sizing the stop distance, not for anticipating direction.
Gap fill between calendar days
SR3
| Day | Gap up | Gap down | Sessions |
|---|---|---|---|
| Monday | 26.5% | 34.4% | 384 |
| Tuesday | 26.7% | 27.0% | 302 |
| Wednesday | 28.0% | 24.8% | 272 |
| Thursday | 32.6% | 32.2% | 296 |
| Friday | 31.3% | 21.8% | 281 |
n = 1,535 · 2018-05-07 to 2026-08-28 · exchange data
Here the gap is measured between the close and the open of whole calendar days, not against the regular session. In a contract trading nearly 24 hours that gap is small and fills far more often.
How the day closed, by day of the week
SR3
| Day | Closes green | Closes red | Sessions |
|---|---|---|---|
| Monday | 33.7% | 48.8% | 430 |
| Tuesday | 43.1% | 40.7% | 432 |
| Wednesday | 43.0% | 42.6% | 430 |
| Thursday | 41.7% | 44.4% | 432 |
| Friday | 40.6% | 44.1% | 426 |
n = 2,150 · 2018-05-07 to 2026-08-28 · exchange data
Close versus the same day's open. If both columns sit near 50%, the day of the week on its own says nothing: that is the most common result and also the most useful to know.
After an inside day, does it break the prior range?
SR3
| Day | Breaks | Stays inside | Sessions |
|---|---|---|---|
| Monday | 64.4% | 35.6% | 180 |
| Tuesday | 78.4% | 21.6% | 204 |
| Wednesday | 80.6% | 19.4% | 232 |
| Thursday | 72.4% | 27.6% | 232 |
| Friday | 76.3% | 23.7% | 228 |
n = 1,076 · 2018-05-07 to 2026-08-28 · exchange data
Inside day = its high and low fit within the prior day's range. Breaking out is the norm; what informs is how far this instrument sits from that norm.
How close the day's range is to its average
SR3
| Kind of day | Frequency | Days |
|---|---|---|
| Compressed (under 70% of the average range) | 42.4% | 906 |
| Normal (70-130%) | 31.4% | 671 |
| Expanded (over 130%) | 26.2% | 559 |
n = 2,136 · 2018-05-29 to 2026-08-28 · exchange data
Compares each session's range with the instrument's own recent average range.
Streaks: does the direction carry into the next day?
SR3
| Streak | Continues | Days |
|---|---|---|
| After 1 day in the same direction | 51.1% | 1,029 |
| After 2 days | 50.2% | 526 |
| After 3 days or more | 55.6% | 594 |
n = 2,149 · 2018-05-07 to 2026-08-28 · exchange data
Measures whether the next day closes in the same direction as the streak. Mostly useful for checking whether 'after three days it turns' holds for this instrument.
To understand these numbers
These guides explain how each concept is calculated and how to read it without fooling yourself.
Value Area, POC, VAH and VAL: How to Read Value
Position Sizing in Futures: How to Calculate It
Opening Gap in Index Futures: A Data-Driven Guide
Base Rates in Trading: What They Are and How to Read Them
Other instruments in the family
Historical frequencies describe what happened; they do not guarantee what will happen and are not investment advice.