instrument report · Crypto
Bitcoin BTC
Historical statistics for Bitcoin over 10,876 observations, from 2017-12-18 to 2026-10-23. Every table shows its sample size (n) next to the percentage.
What sets this instrument apart
- An upside gap between one day's close and the next day's open fills in BTC between 55.9% of the time on a Monday (n = 270) and 89.8% on a Friday (n = 206). The gap between Friday and Monday exceeds noise (two-proportion test, Holm-corrected over the 10 pairs of days), but in a contract trading nearly 24 hours that gap is small, which is why it closes so often: it is not a tradable edge.
Tables
Historical frequencies, not forecasts: each row's sample size sits on the right.
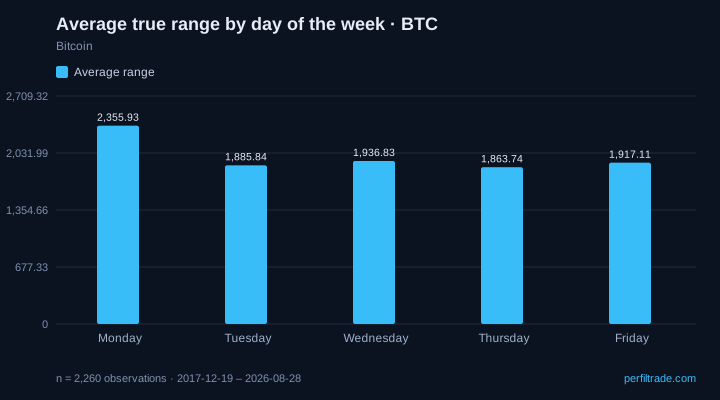
Average true range by day of the week
BTC
Swipe to see the sample →
| Day | Average range | Sessions |
|---|---|---|
| Monday | 2,351.2 pts | 455 |
| Tuesday | 1,913.1 pts | 460 |
| Wednesday | 1,942.6 pts | 458 |
| Thursday | 1,876.4 pts | 460 |
| Friday | 1,985.5 pts | 453 |
n = 2,286 · 2017-12-19 to 2026-10-23 · historical futures data
Average daily true range in the instrument's own points. Measures size, not direction.
After an inside day, does it break the prior range?
BTC
Swipe to see the sample →
| Day | Breaks | Stays inside | Sessions |
|---|---|---|---|
| Monday | 82.1% | 17.9% | 301 |
| Tuesday | 77.6% | 22.4% | 433 |
| Wednesday | 83.5% | 16.5% | 437 |
| Thursday | 78.9% | 21.1% | 418 |
| Friday | 81.6% | 18.4% | 353 |
n = 1,942 · 2017-12-18 to 2026-10-23 · historical futures data
Inside day = its high and low fit within the prior day's range. Breaking out is the norm; what informs is how far this instrument sits from that norm.
How close the day's range is to its average
BTC
Swipe to see the sample →
| Kind of day | Frequency | Days |
|---|---|---|
| Compressed (under 70% of the average range) | 29.1% | 661 |
| Normal (70-130%) | 49.8% | 1,131 |
| Expanded (over 130%) | 21.2% | 481 |
n = 2,273 · 2018-01-09 to 2026-10-23 · historical futures data
Compares each session's range with the instrument's own recent average range.
Monthly snapshot of October 24, 2026.
In the platform
These tables, with every row and refreshed every night, are inside Perfiltrade.
- Gap fill between calendar daysn = 2,108
- Sessions with a range above the average of the prior 20n = 2,267
How to cite this data
The tables on this page are our own work, built from historical futures data. You may reproduce them, translate them or build on them, including commercially, as long as you credit the source and link back to the original page. If you use them, tell us: we like knowing what they get used for.
Licence: CC BY 4.0
Suggested citation:
Perfiltrade (October 24, 2026). Bitcoin (BTC): how much it moves, with its sample. https://www.perfiltrade.com/en/instruments/btc
The weekly report, every Sunday
One email a week: what moved the macro picture, next week's calendar, rates and COT positioning, and the new study with its sample size. No signals; unsubscribe in one click.
To understand these numbers
These guides explain how each concept is calculated and how to read it without fooling yourself.
Position Sizing in Futures: How to Calculate It
Base Rates in Trading: What They Are and How to Read Them
Opening Gap in Index Futures: A Data-Driven Guide
Market Profile: What It Is and How to Read It in Futures
VAH, VAL and POC: How to Read the Value Area in Futures
Other instruments in the family
Follow BTC for free, with no end date
On Free, with no end date: the sentence of the day for one market of your choice, 3 alerts by Telegram or webhook and the risk calculator. Trader opens the full tables of all 30 markets.
Historical frequencies describe what happened; they do not guarantee what will happen and are not investment advice.